Posted on 7/3/2018 in Web Development
Have you heard of Google Analytics Add-on for Google Sheets? If you are an active Google Analytics user, you should take advantage of this neat tool. The GA Add-on makes it easier for you to view, share, and manipulate data in Google Spreadsheets. With this tool you can:
- Pull any data from the Analytics API across multiple views.
- Compute and display custom calculations based on your reporting needs.
- Create visualizations using your data (pie charts, line graphs, funnels, etc.)
- Schedule your reports to run and update automatically.
- Control who can see your data and visualizations using the existing Google Sheets privacy and sharing options.
The GA Add-on tool links to your existing Google Analytics account and uses Google Analytics API and Regular Expressions to gather and filter your data. This tool streamlines your GA reporting process, so you no longer have to manually pull data from GA for your reporting needs. Once you configure the GA Add-on feature in Google Sheets, you can automate the reports to run hourly, daily, weekly, or monthly.
Enough of the small talk, here is how to integrate the Google Analytics Add-on tool to your Google Sheets:
1. Create a new Google Sheet- https://docs.google.com/spreadsheets/
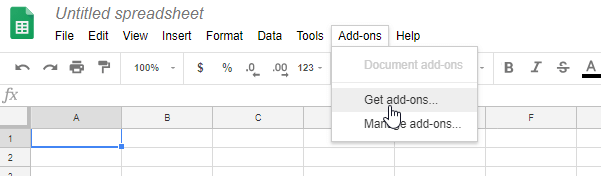
2. In the menu bar > Select “Get Add On” > Choose Google Analytics Add-on > Click the "+" in the top right corner to add this add-on to your spreadsheet.
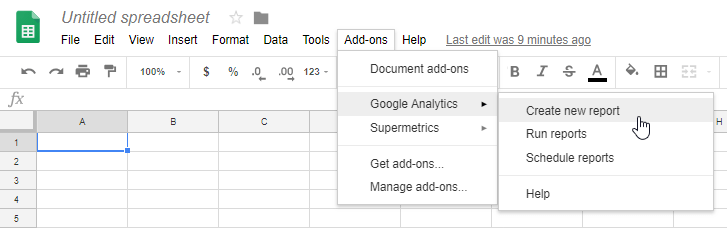
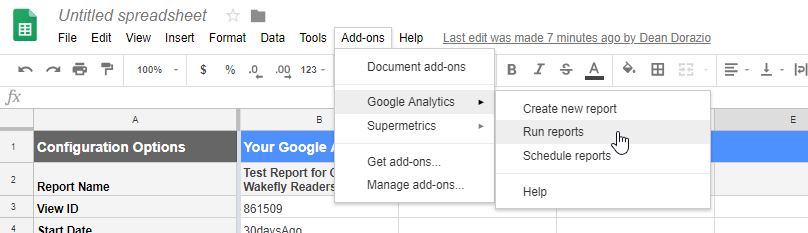
3. Go back to the menu bar in your Google Sheet > Select Add-Ons > Google Analytics > Create New Report.
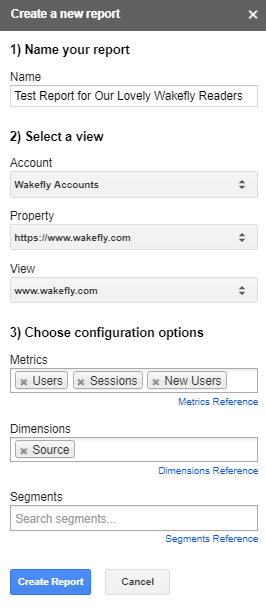
4. The GA Add-On menu will then appear on the right side of the page, this is where you will set your account information and fill out the metrics and dimensions you want to analyze. Click on “Create Report”.
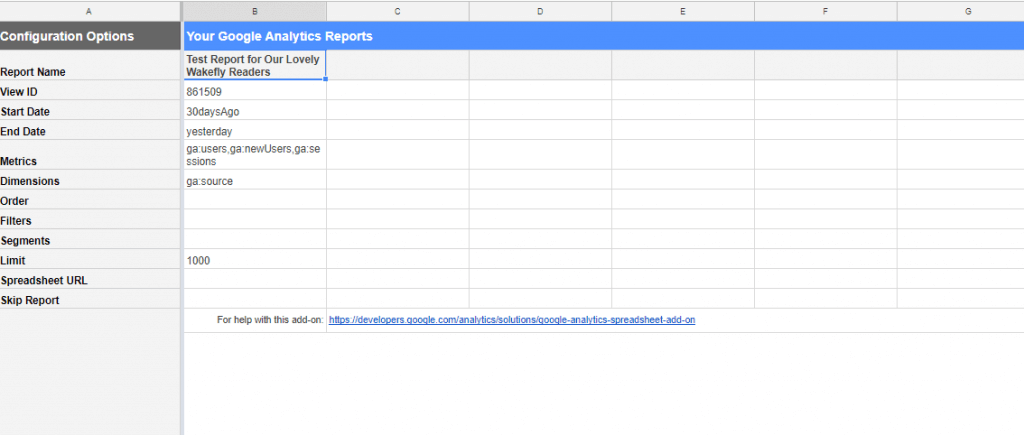
5. After the Google Sheet should reload a new sheet, this is your report configuration sheet.
6. We’re almost done! Now that you’ve set up the GA Add-on, it’s time to run the report! Go to the menu bar > Add-ons > Google Analytics > Run reports.
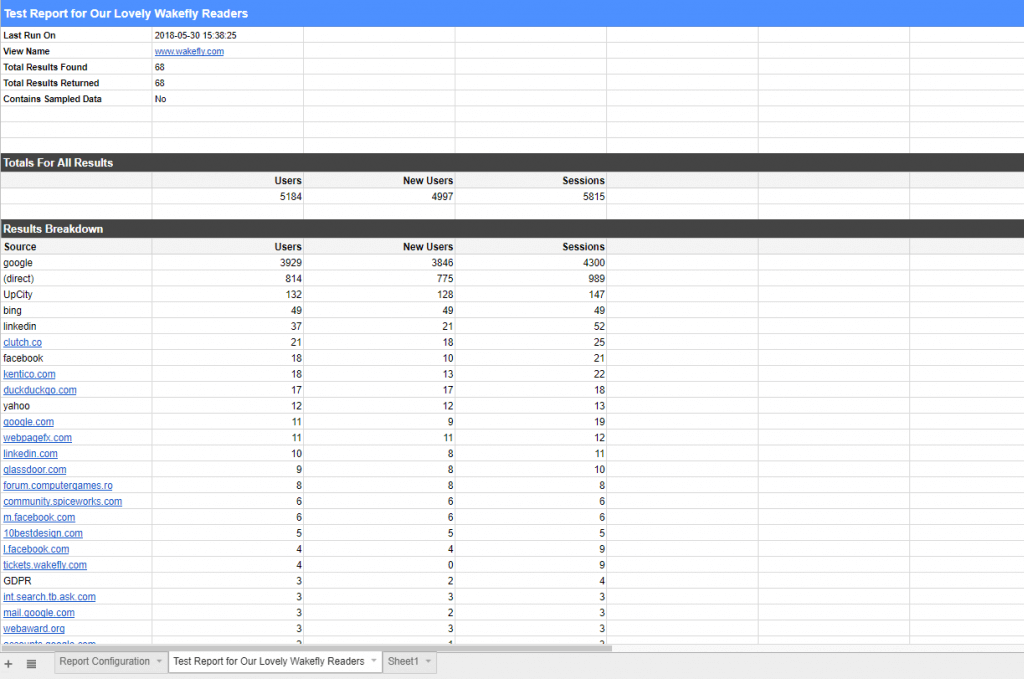
7. When you run the report, you should see a notification pop-up to let you know that the report was either successfully completed or something went wrong (which may require some troubleshooting in the report configuration tab). If the report successfully runs, you will see a new tab which shows you the actual report, check it out!
Once you feel comfortable with the steps above, feel free to manipulate the relative cells in the report configuration tab- add more reports, different views, date ranges, metrics, dimensions, segments, filters, and more.
If you want to automate and schedule this report go to the menu bar > Add-ons > Google Analytics > Schedule reports > select your schedule option.
Want to see how you can use this GA Add-On to build your own automated report with visualizations? CLICK HERE- https://goo.gl/GioAz2 (you can view the report configuration and aggregate data tabs to see how everything blends into the “Monthly Summary Report”).
Here are additional helpful links you can use in your GA Add-On Journey:
Google Analytics Spreadsheet Add-on- https://developers.google.com/analytics/solutions/google-analytics-spreadsheet-add-on
Dimensions & Metrics Explorer- https://developers.google.com/analytics/devguides/reporting/core/dimsmets
Core Reporting API - Reference Guide - Filters- https://developers.google.com/analytics/devguides/reporting/core/v3/reference#filters
Google spreadsheets Function List- https://support.google.com/docs/table/25273?hl=en
Want to have reports like these created for you?
Contact us today to see how we can help!

Related Articles

Preparing a Website Redesign Budget for 2025: A Step-by-Step Guide
As we approach 2025, businesses are recognizing the necessity of a fresh, user-friendly website to stay competitive in a rapidly evolving digital [...]

Demystifying SPF, DKIM and DMARC: Strengthening Email Security
With Slack and other instant messaging services handling more and more of our online communication, email can sometimes feel like a newspaper being [...]

Elevating Your Brand: The Transformative Power of Website Design
In the digital age, your website is often the first point of contact between your brand and potential customers. It's not just a platform to showcase [...]